
Antminer S21
Two Analysis Modes — Hashrate and Heat Map.
Switch between hashrate view and heat map to instantly see underperforming miners, hung units, and overheating zones. Early detection helps you prevent major losses.
Hashrate Performance Map
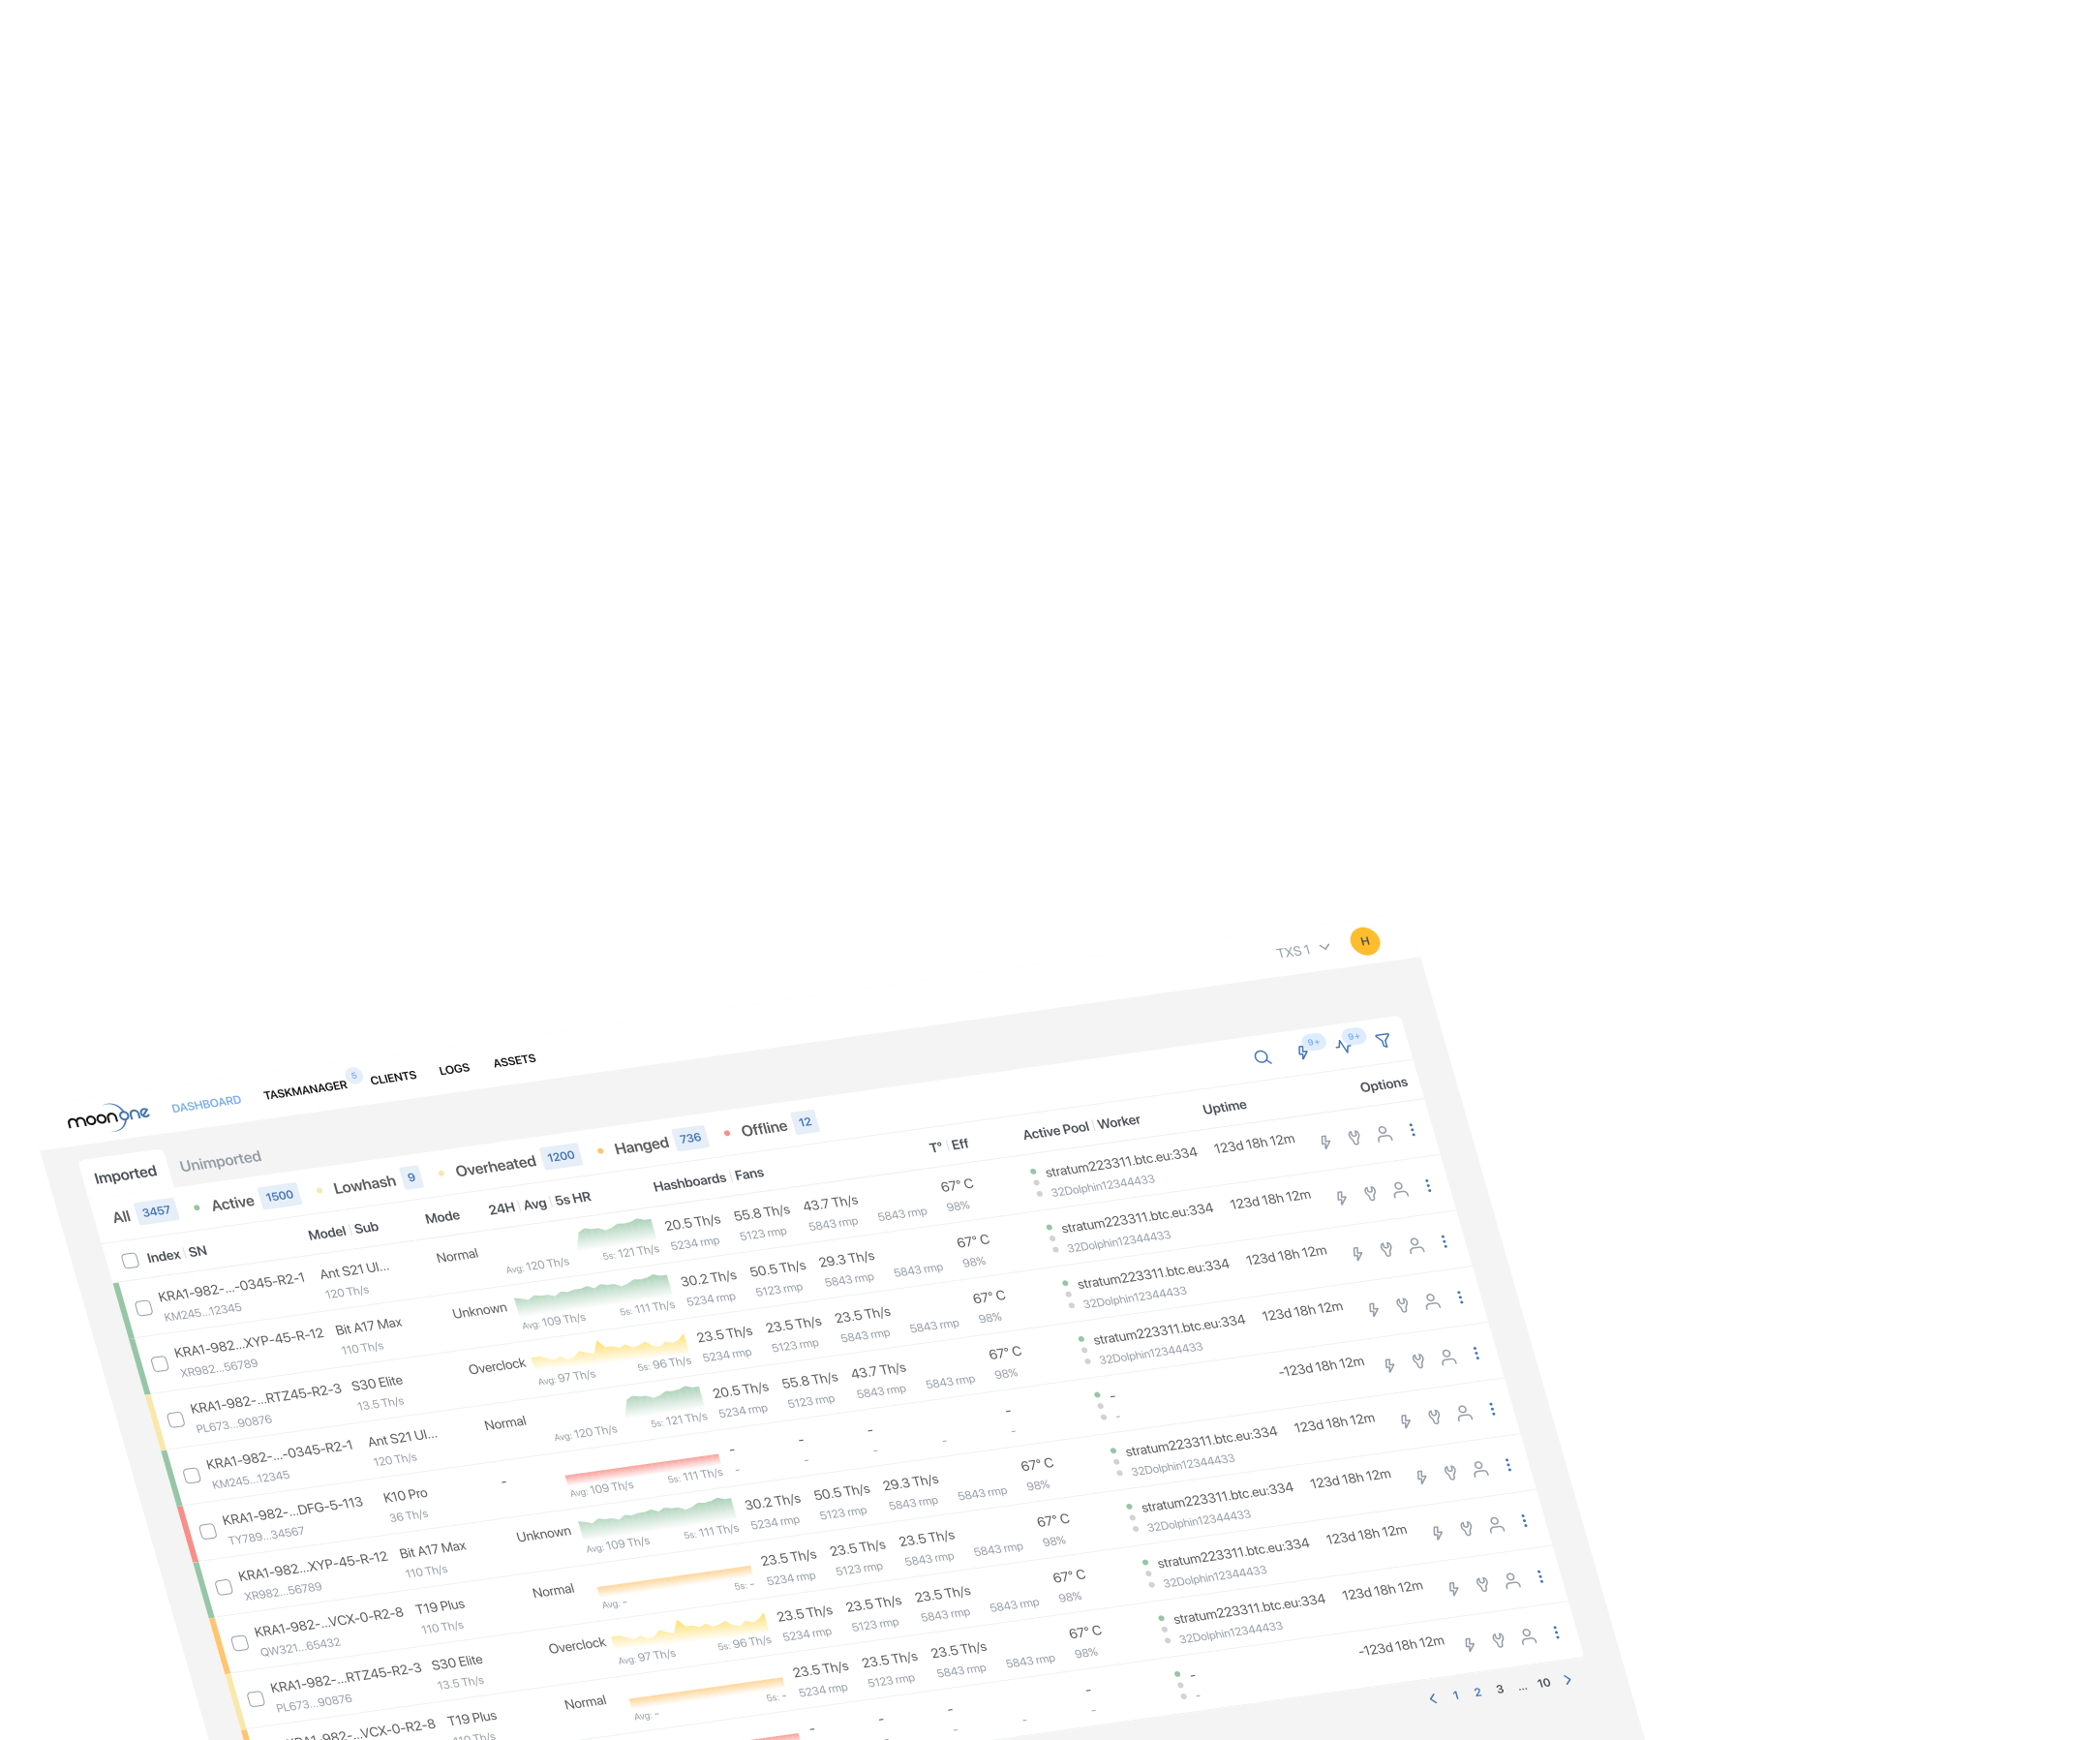
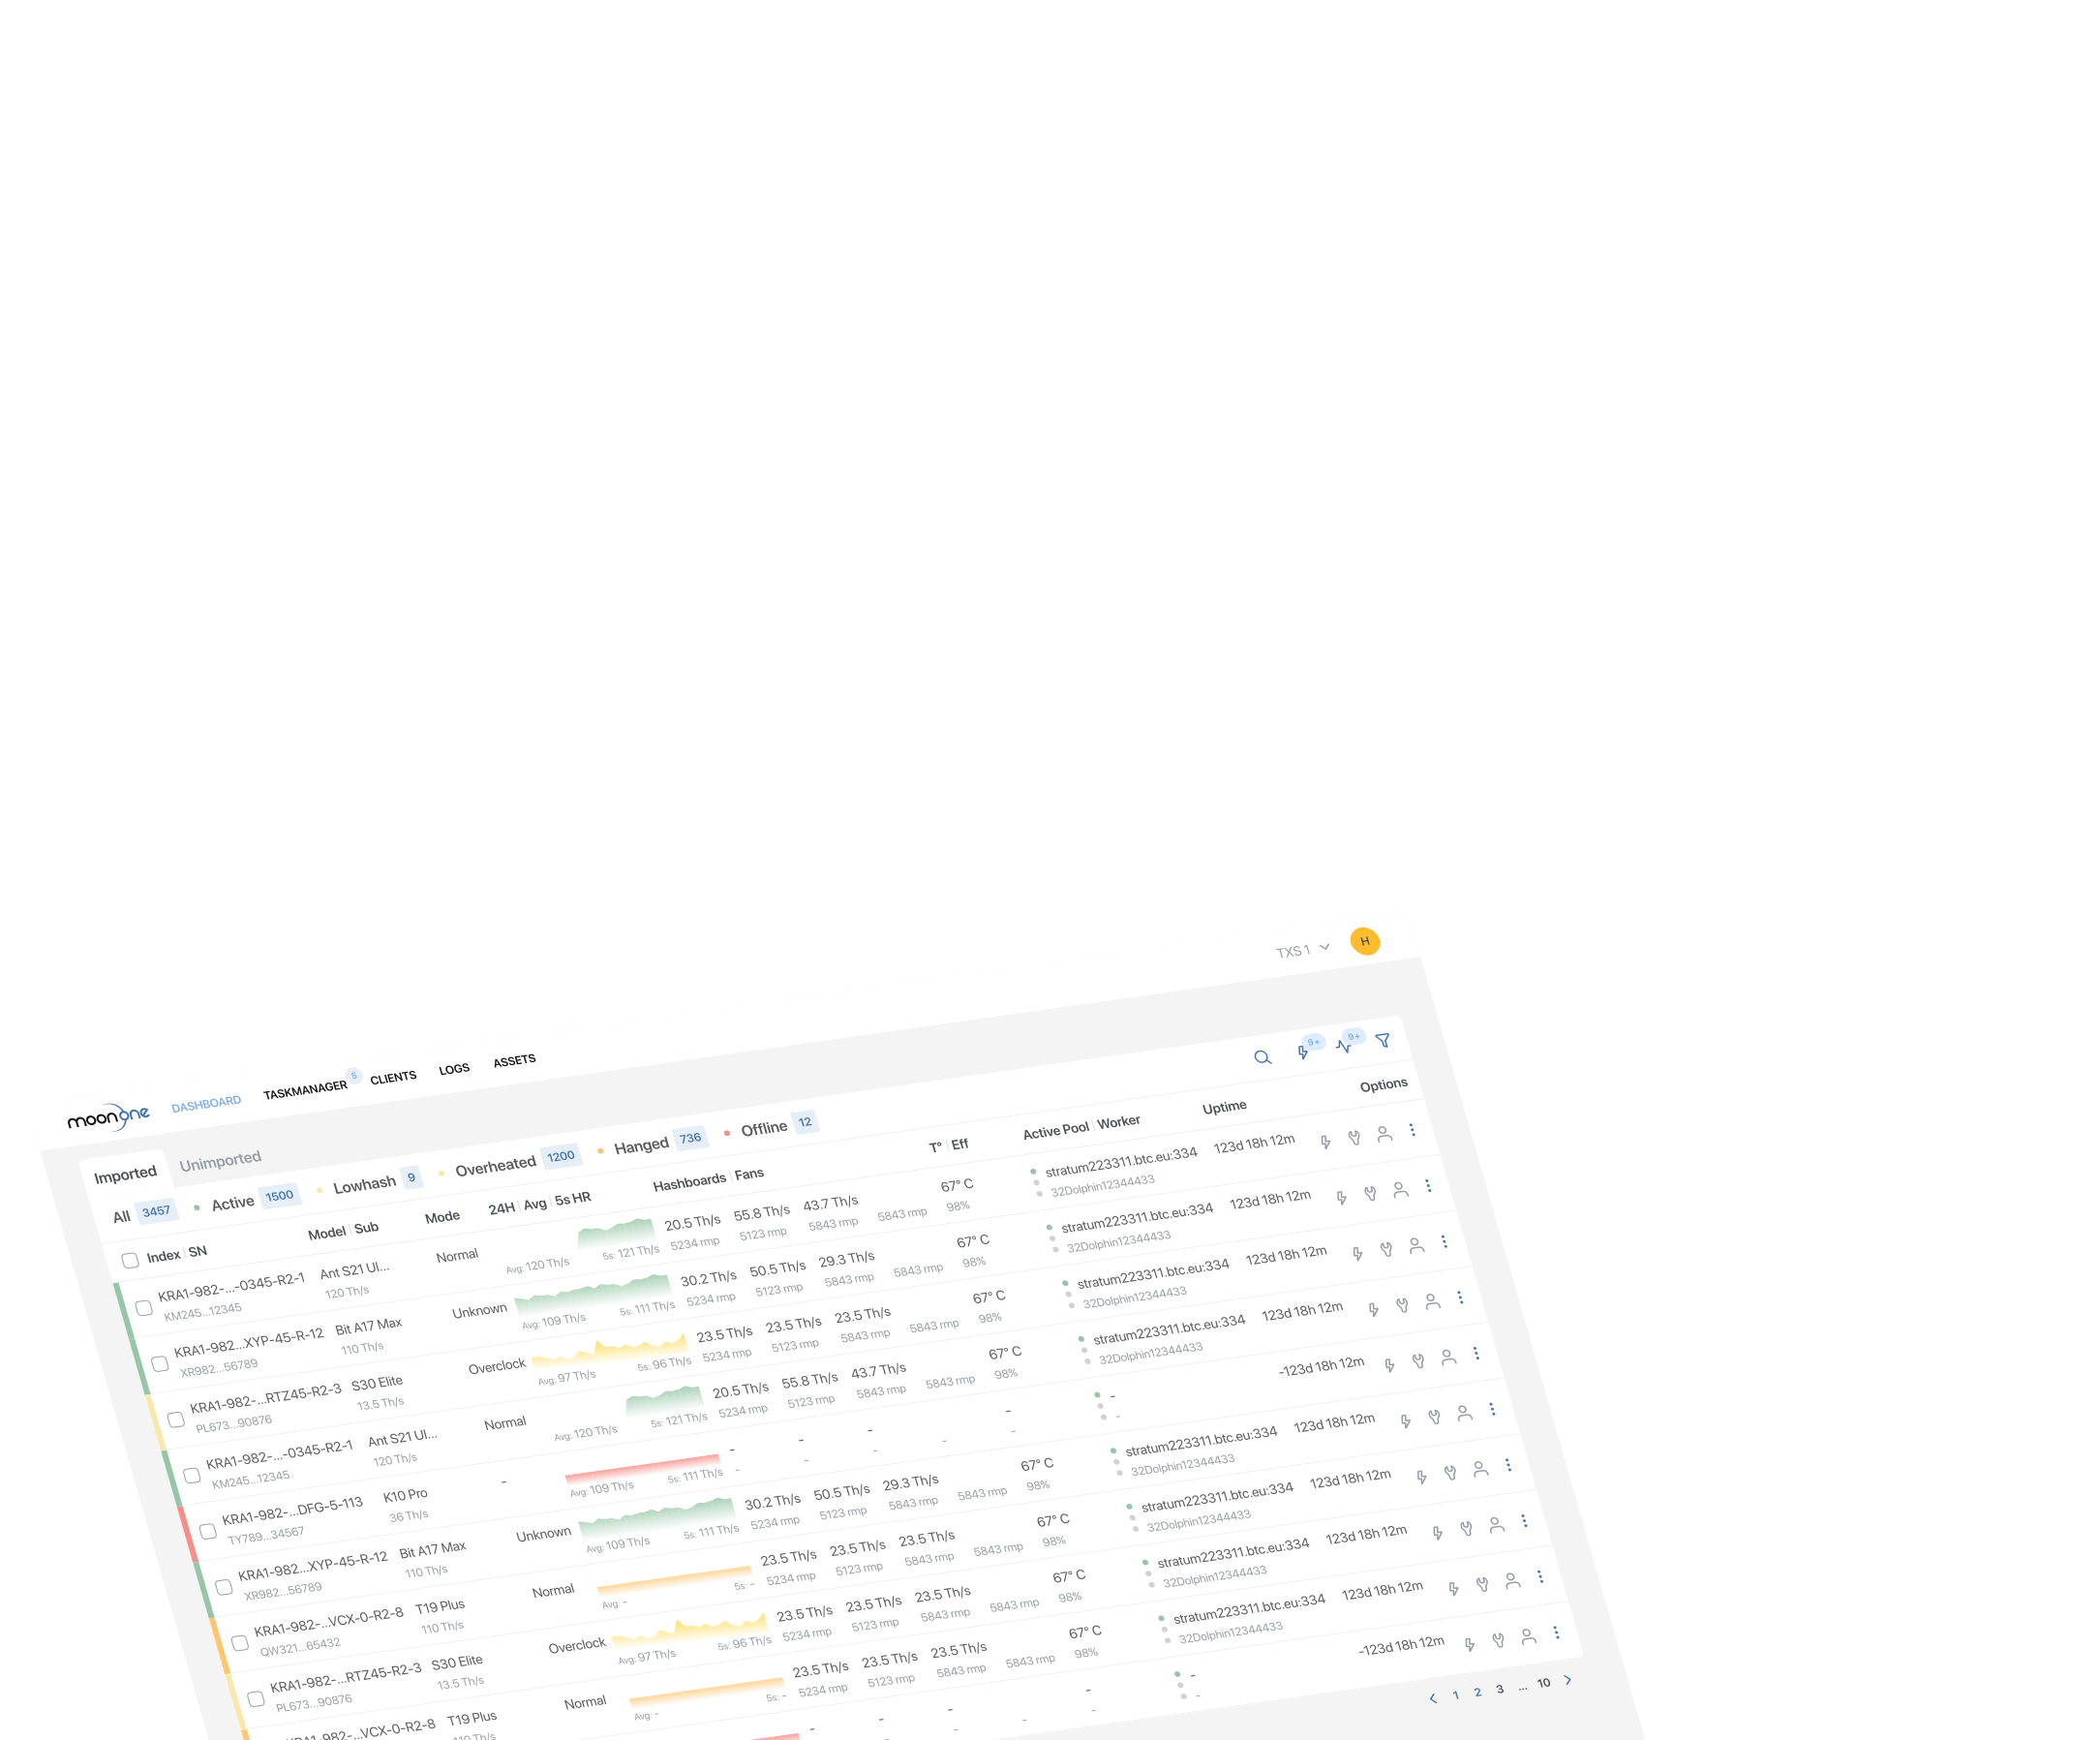
See exactly which ASICs have reduced hashrate, are hung, or completely offline — all directly on your site layout. Visual indicators help you prioritize maintenance effectively.
Heat Map for Overheating Detection
Real-time color-coded temperature visualization highlights hot spots and cooling problems. Identify risky areas before they cause hardware damage or downtime.
What You Get with the Interactive Mining Site Map.
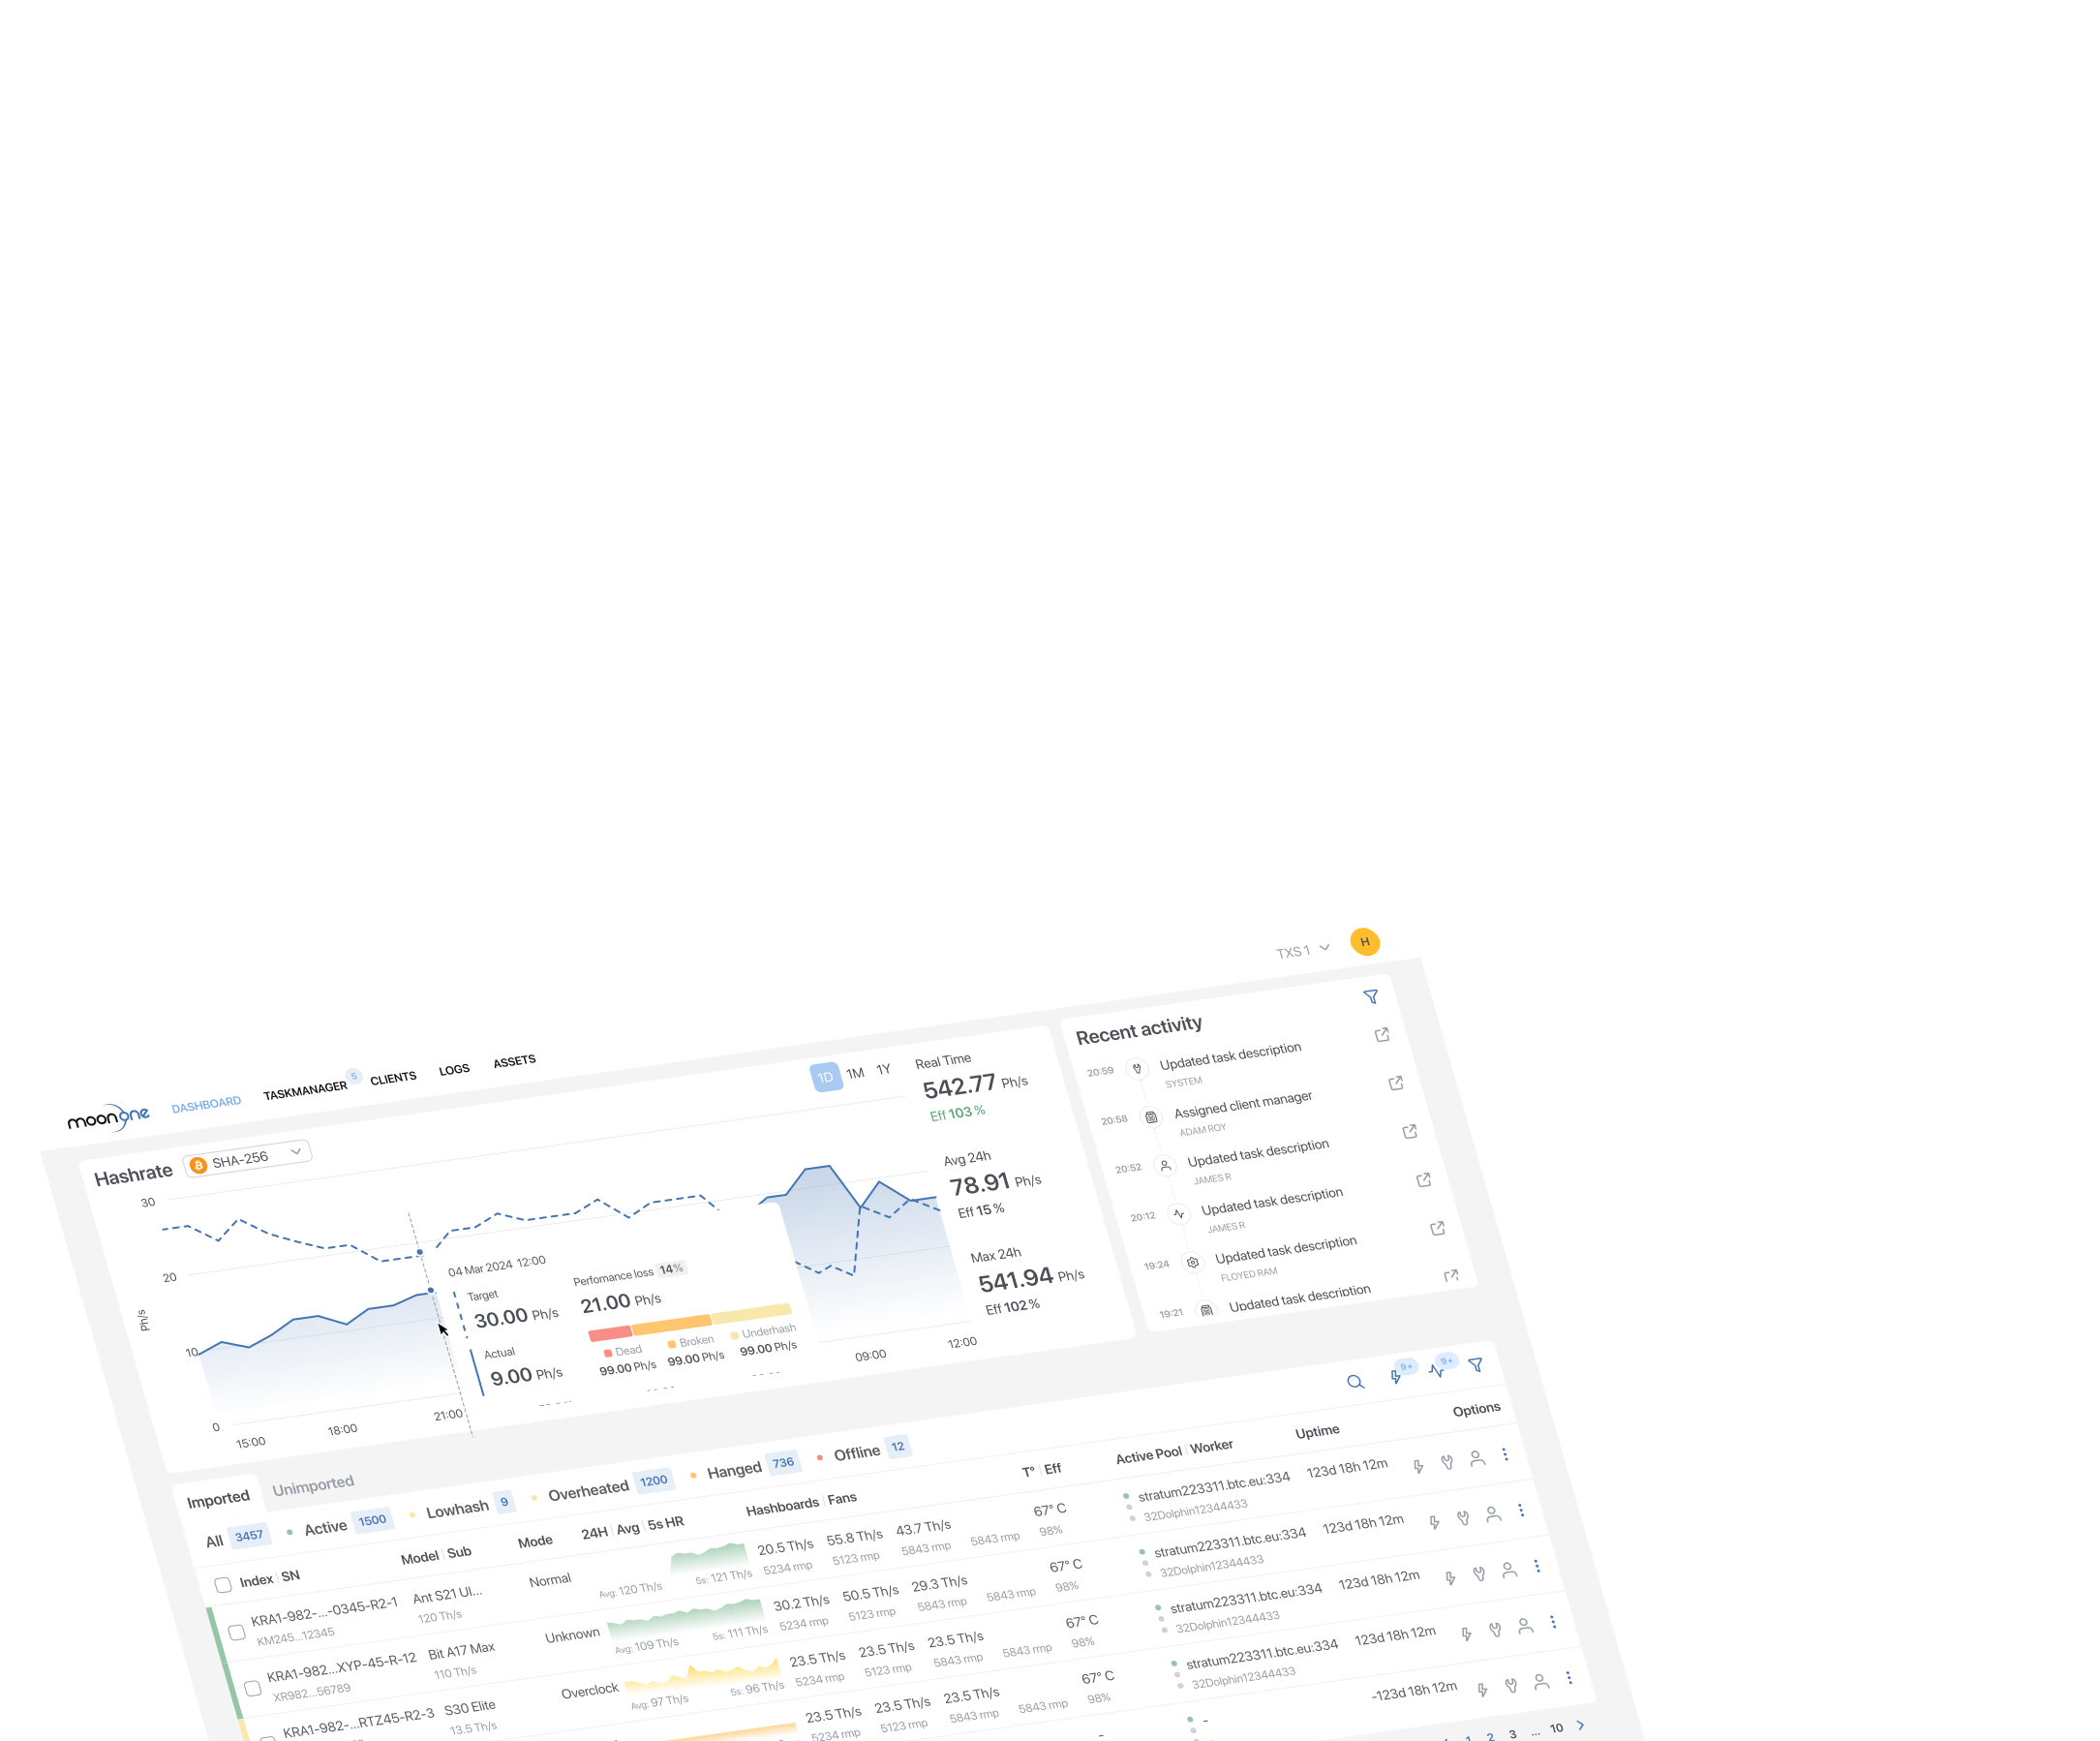
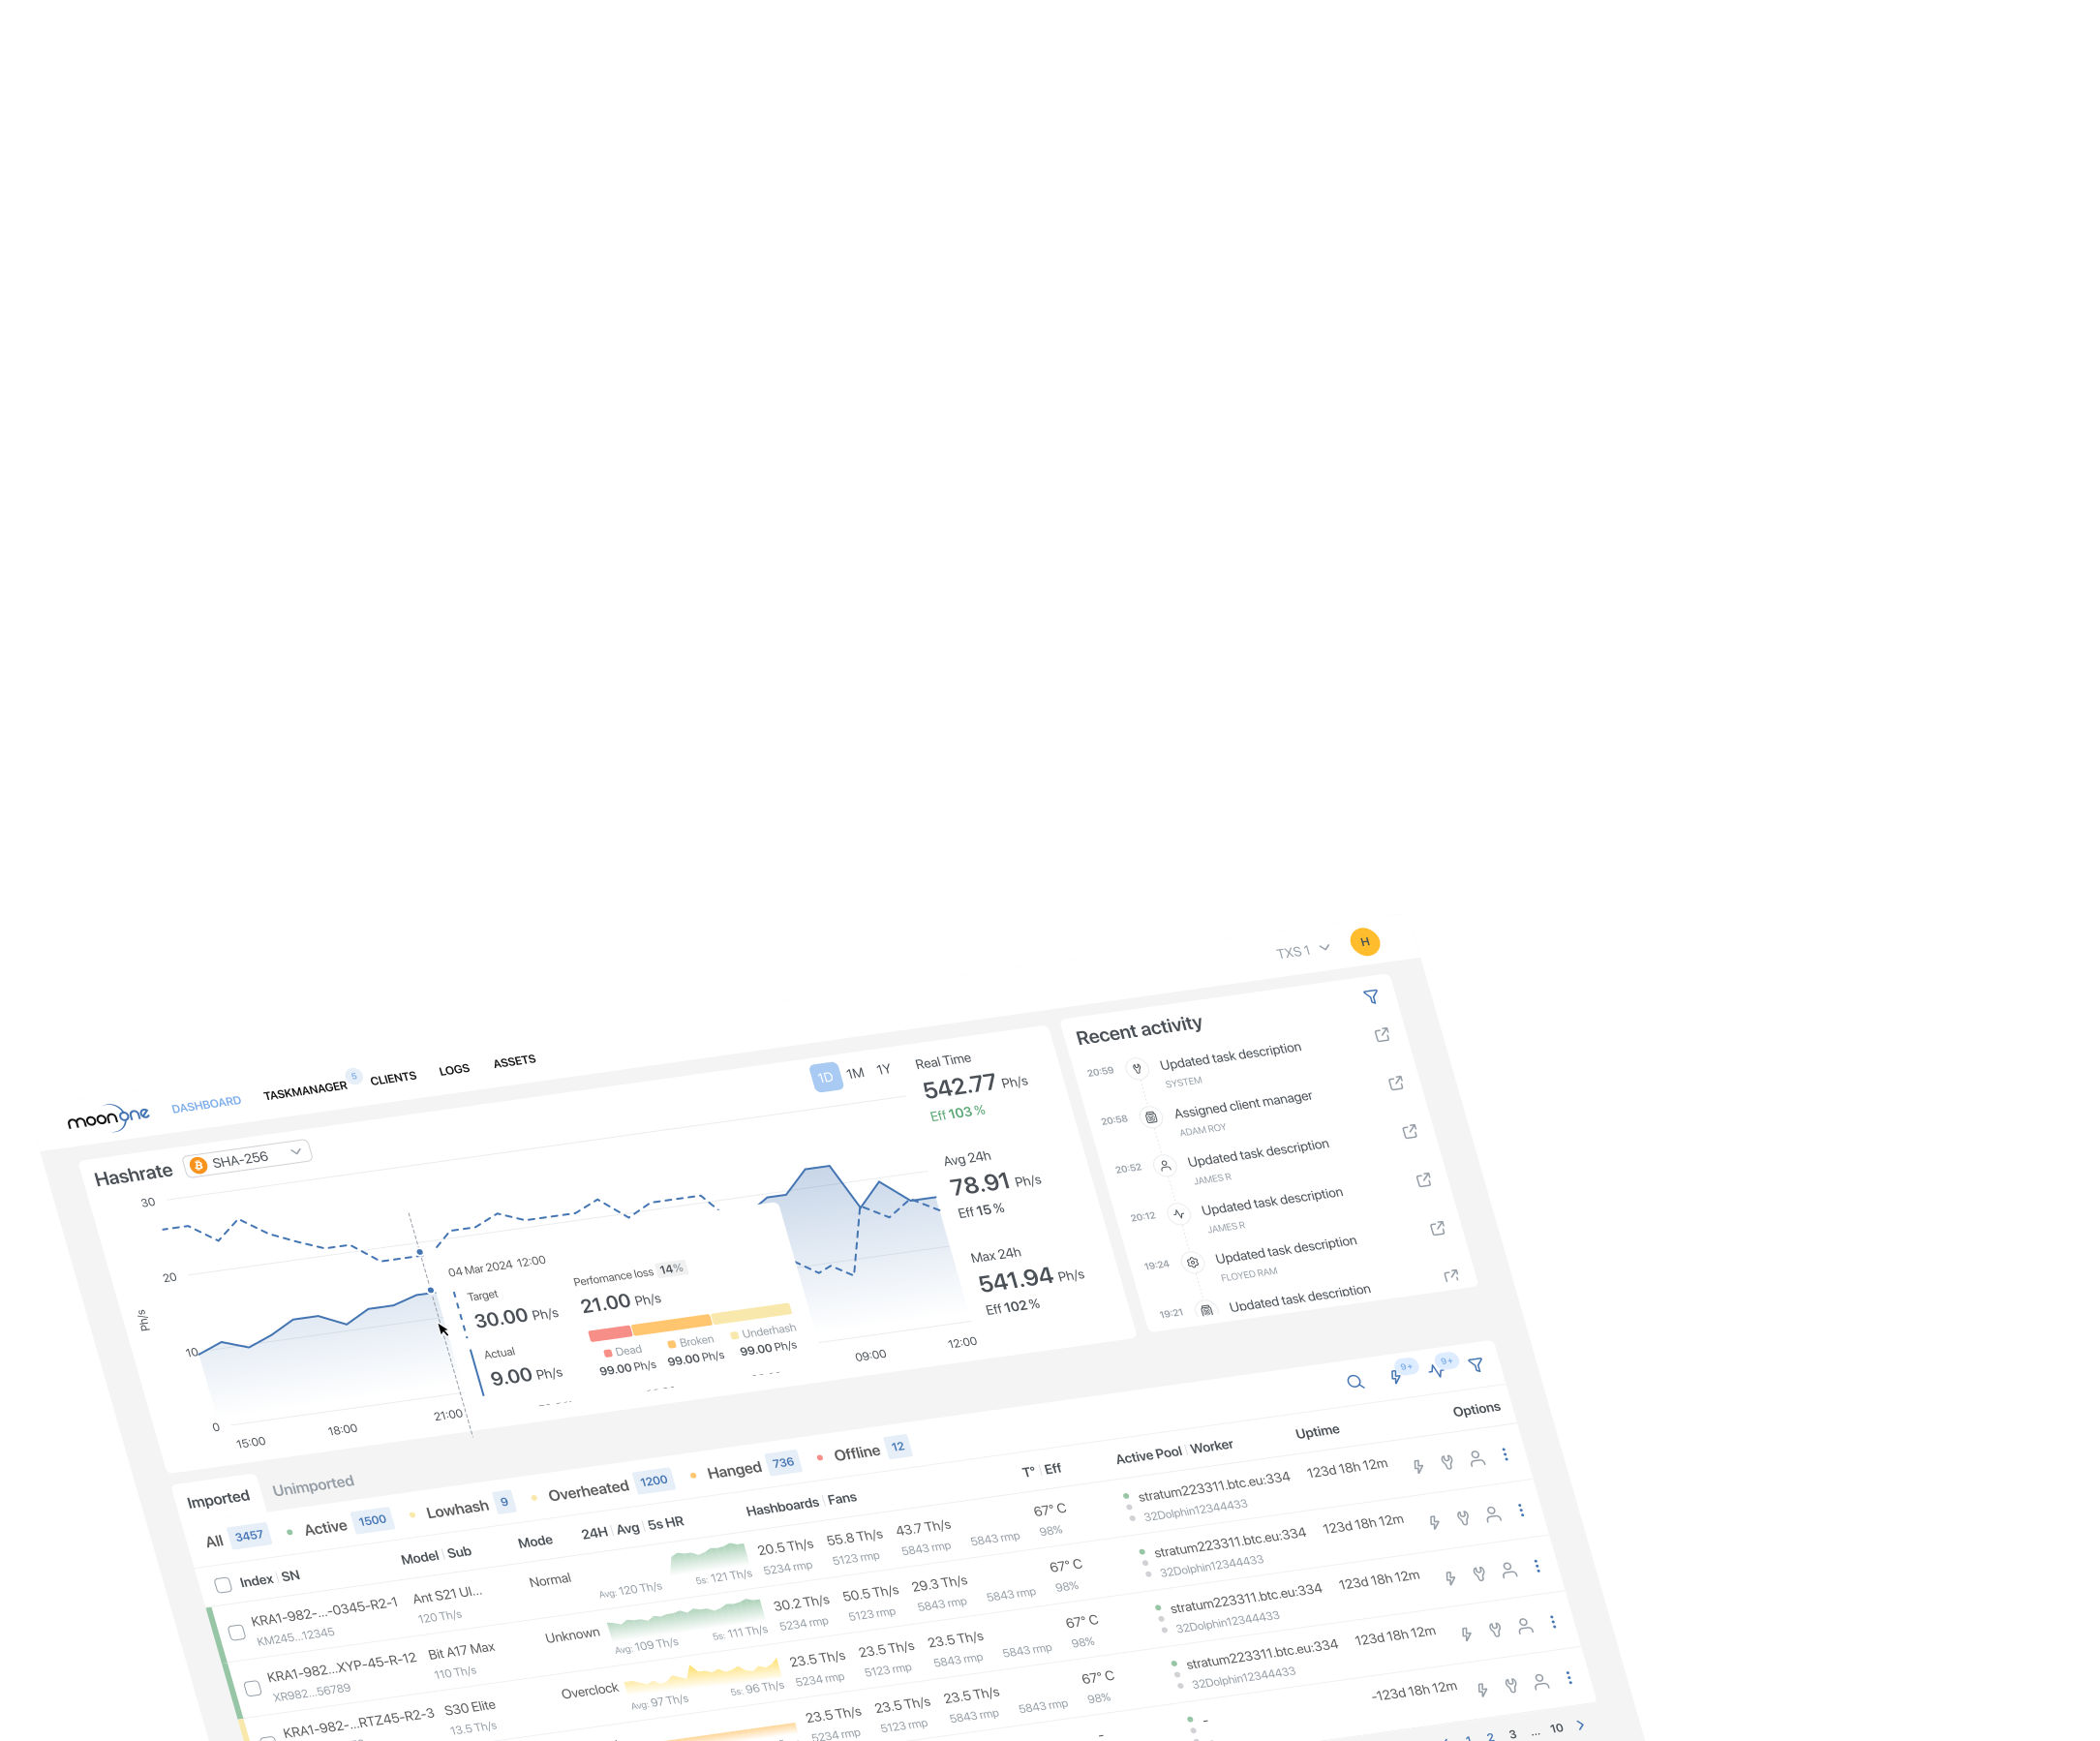
Real-time hashrate, temperature, and miner status all on one map of your facility — so you can spot problems fast and get miners back online quicker.
Catch hot spots with the Heat Map
Real-time temperature visualization helps you identify overheating zones before they cause damage.
Spot offline miners instantly
Status of every ASIC on your layout.
Cut troubleshooting time
All key metrics in one view.
Faster task assignment
Issues flagged before downtime.
Every metric visible
Hashrate, power, temp, status.
Control your entire farm from one dashboard
Full visibility without switching between multiple tools.