
Visual Mining Site Map and Heat Map: Real-Time Control of Your Entire Bitcoin Farm
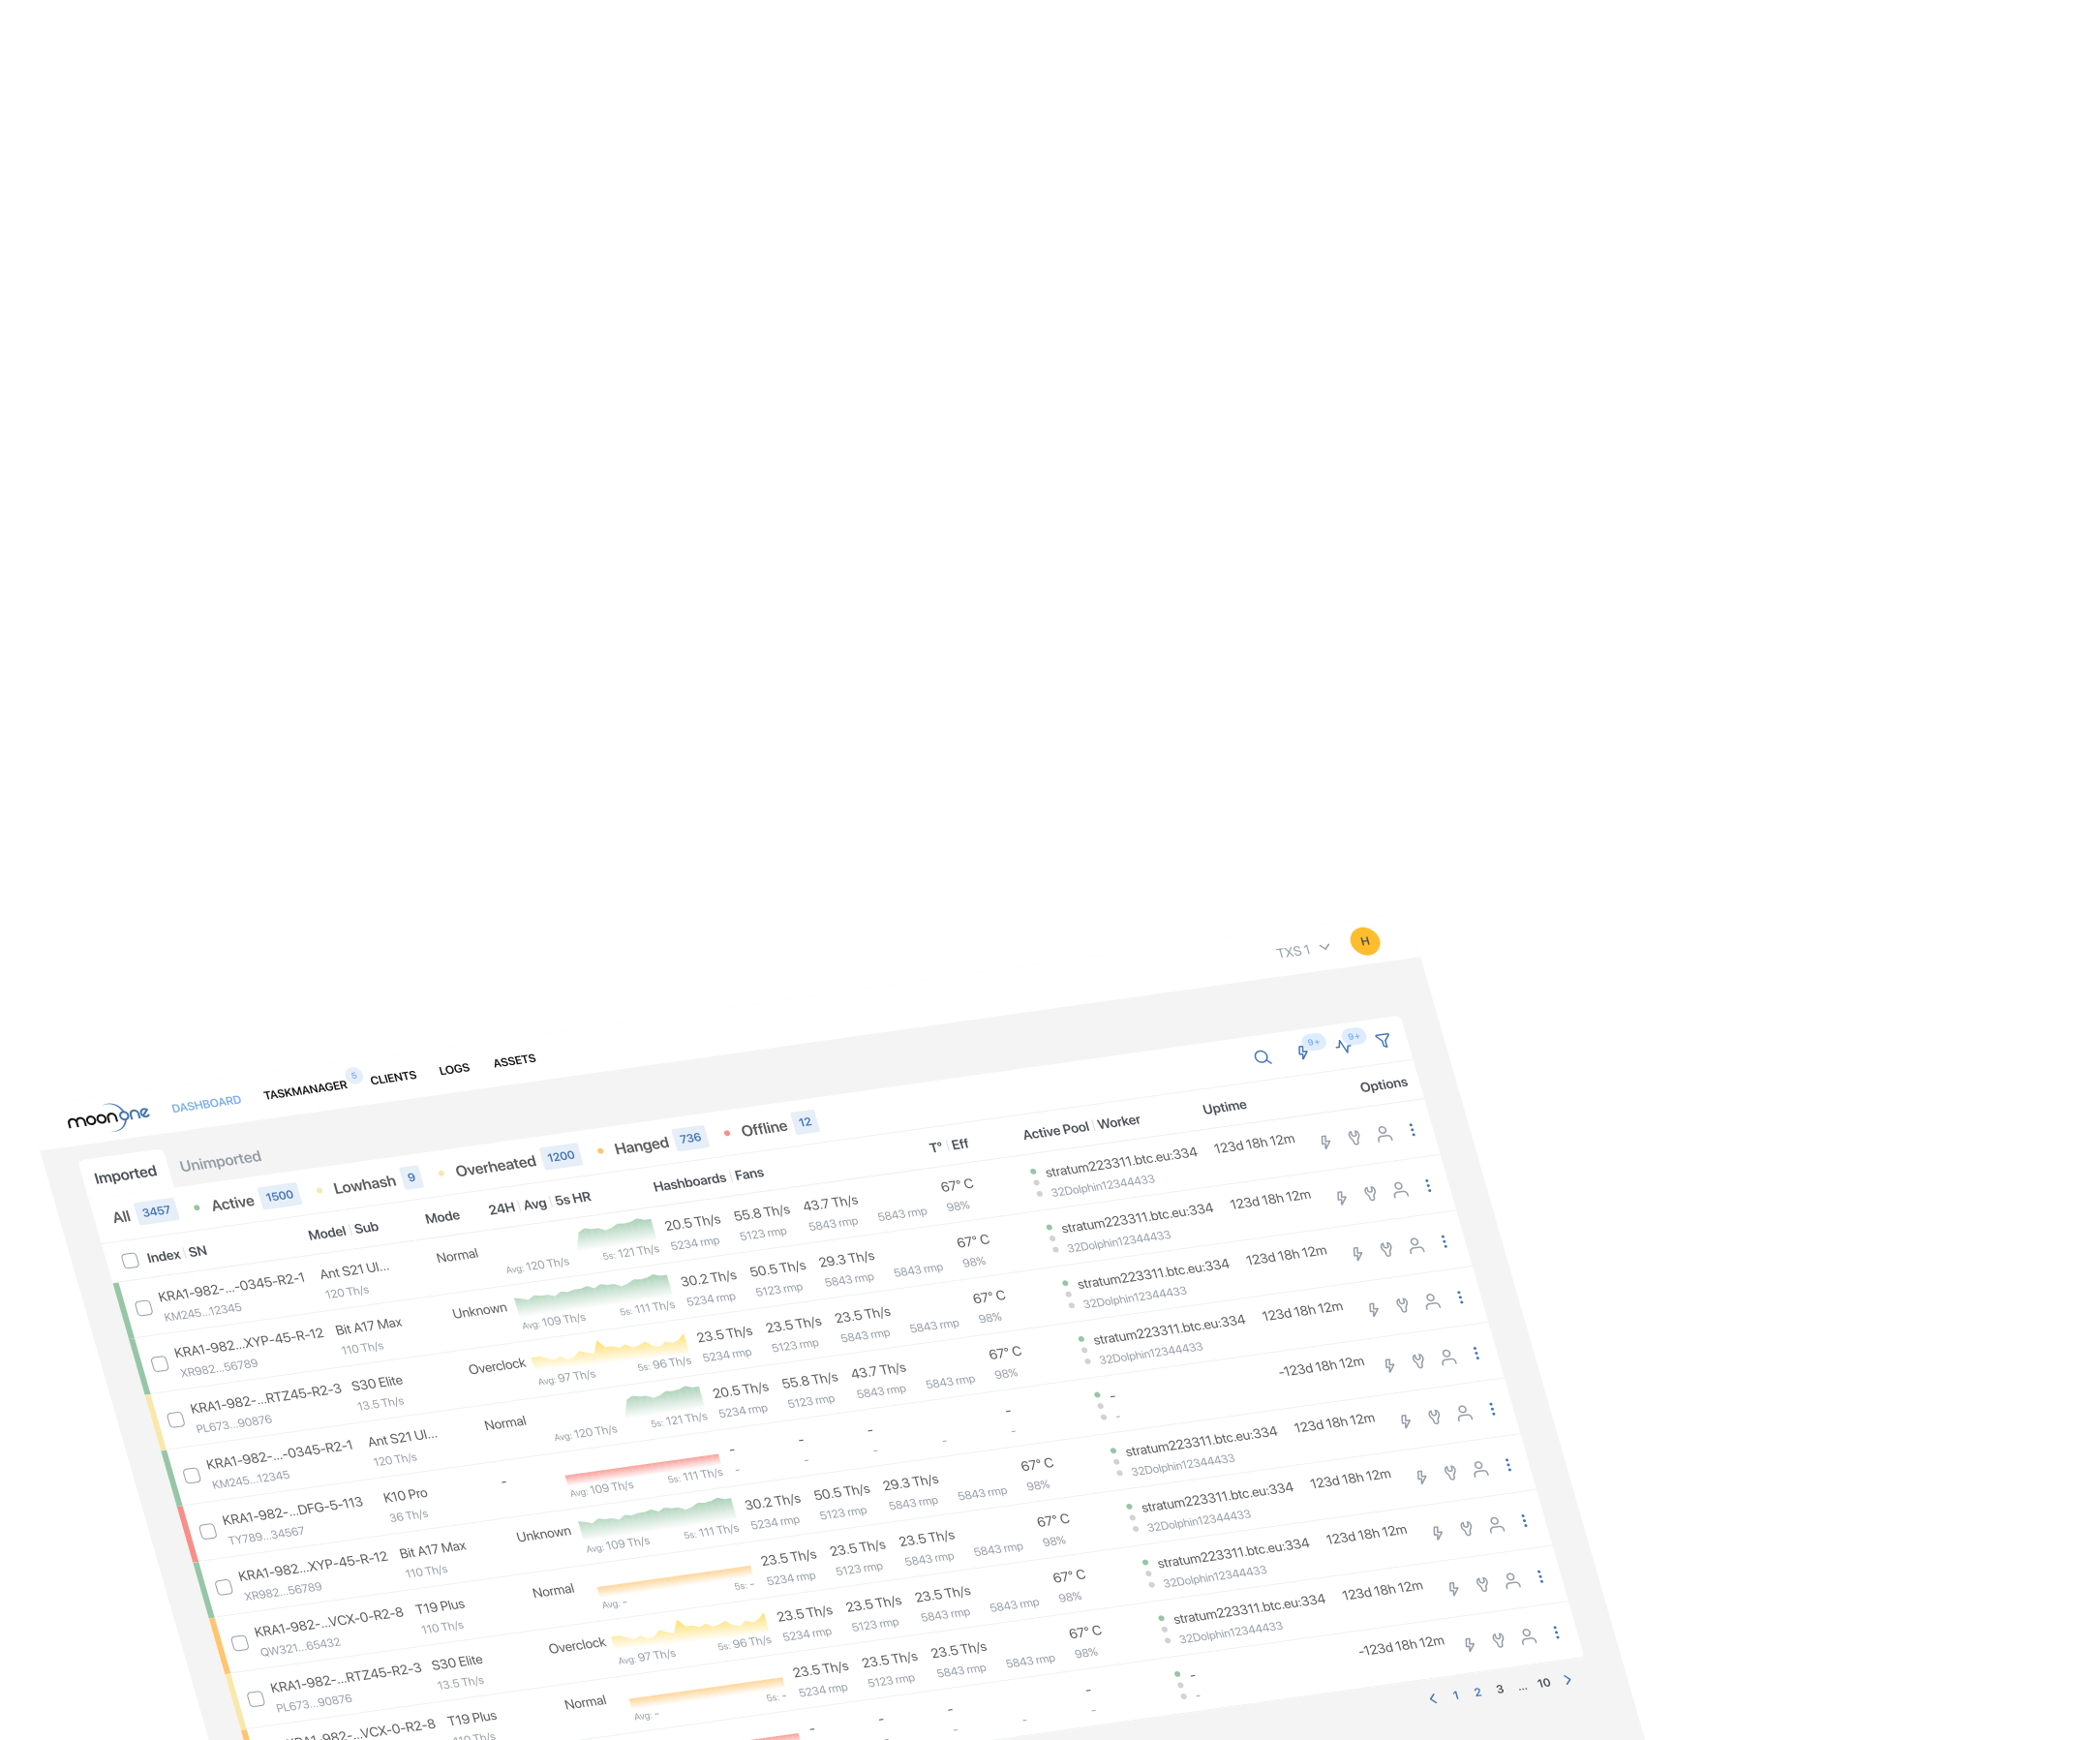
One of the biggest challenges in managing a large Bitcoin mining farm is getting a clear, instant understanding of what is happening across the entire facility. When you have hundreds or thousands of ASICs spread across different rooms or even multiple buildings, it’s easy to lose the big picture. Traditional monitoring systems usually present data in long lists and tables, forcing operators to scroll, filter, and mentally piece together the current situation.
This is where the Visual Mining Site Map and Heat Map become one of the most valuable tools in modern Bitcoin mining management.
As we explored in our article on Bitcoin mining automation, early detection of issues is critical. The Visual Mining Site Map takes this to the next level by giving you a complete visual overview of your entire farm.
As we explored in our article on Bitcoin mining automation, early detection of issues is critical. The Visual Mining Site Map takes this to the next level by giving you a complete visual overview of your entire farm.
Why Visual Control Has Become Essential
In large-scale mining operations, time is the most critical resource. When hashrate drops or temperatures begin to rise, every minute of delay can translate into significant financial losses. The faster operators can locate the problem, assess its scale, and direct technicians to the right place, the less revenue the farm loses.
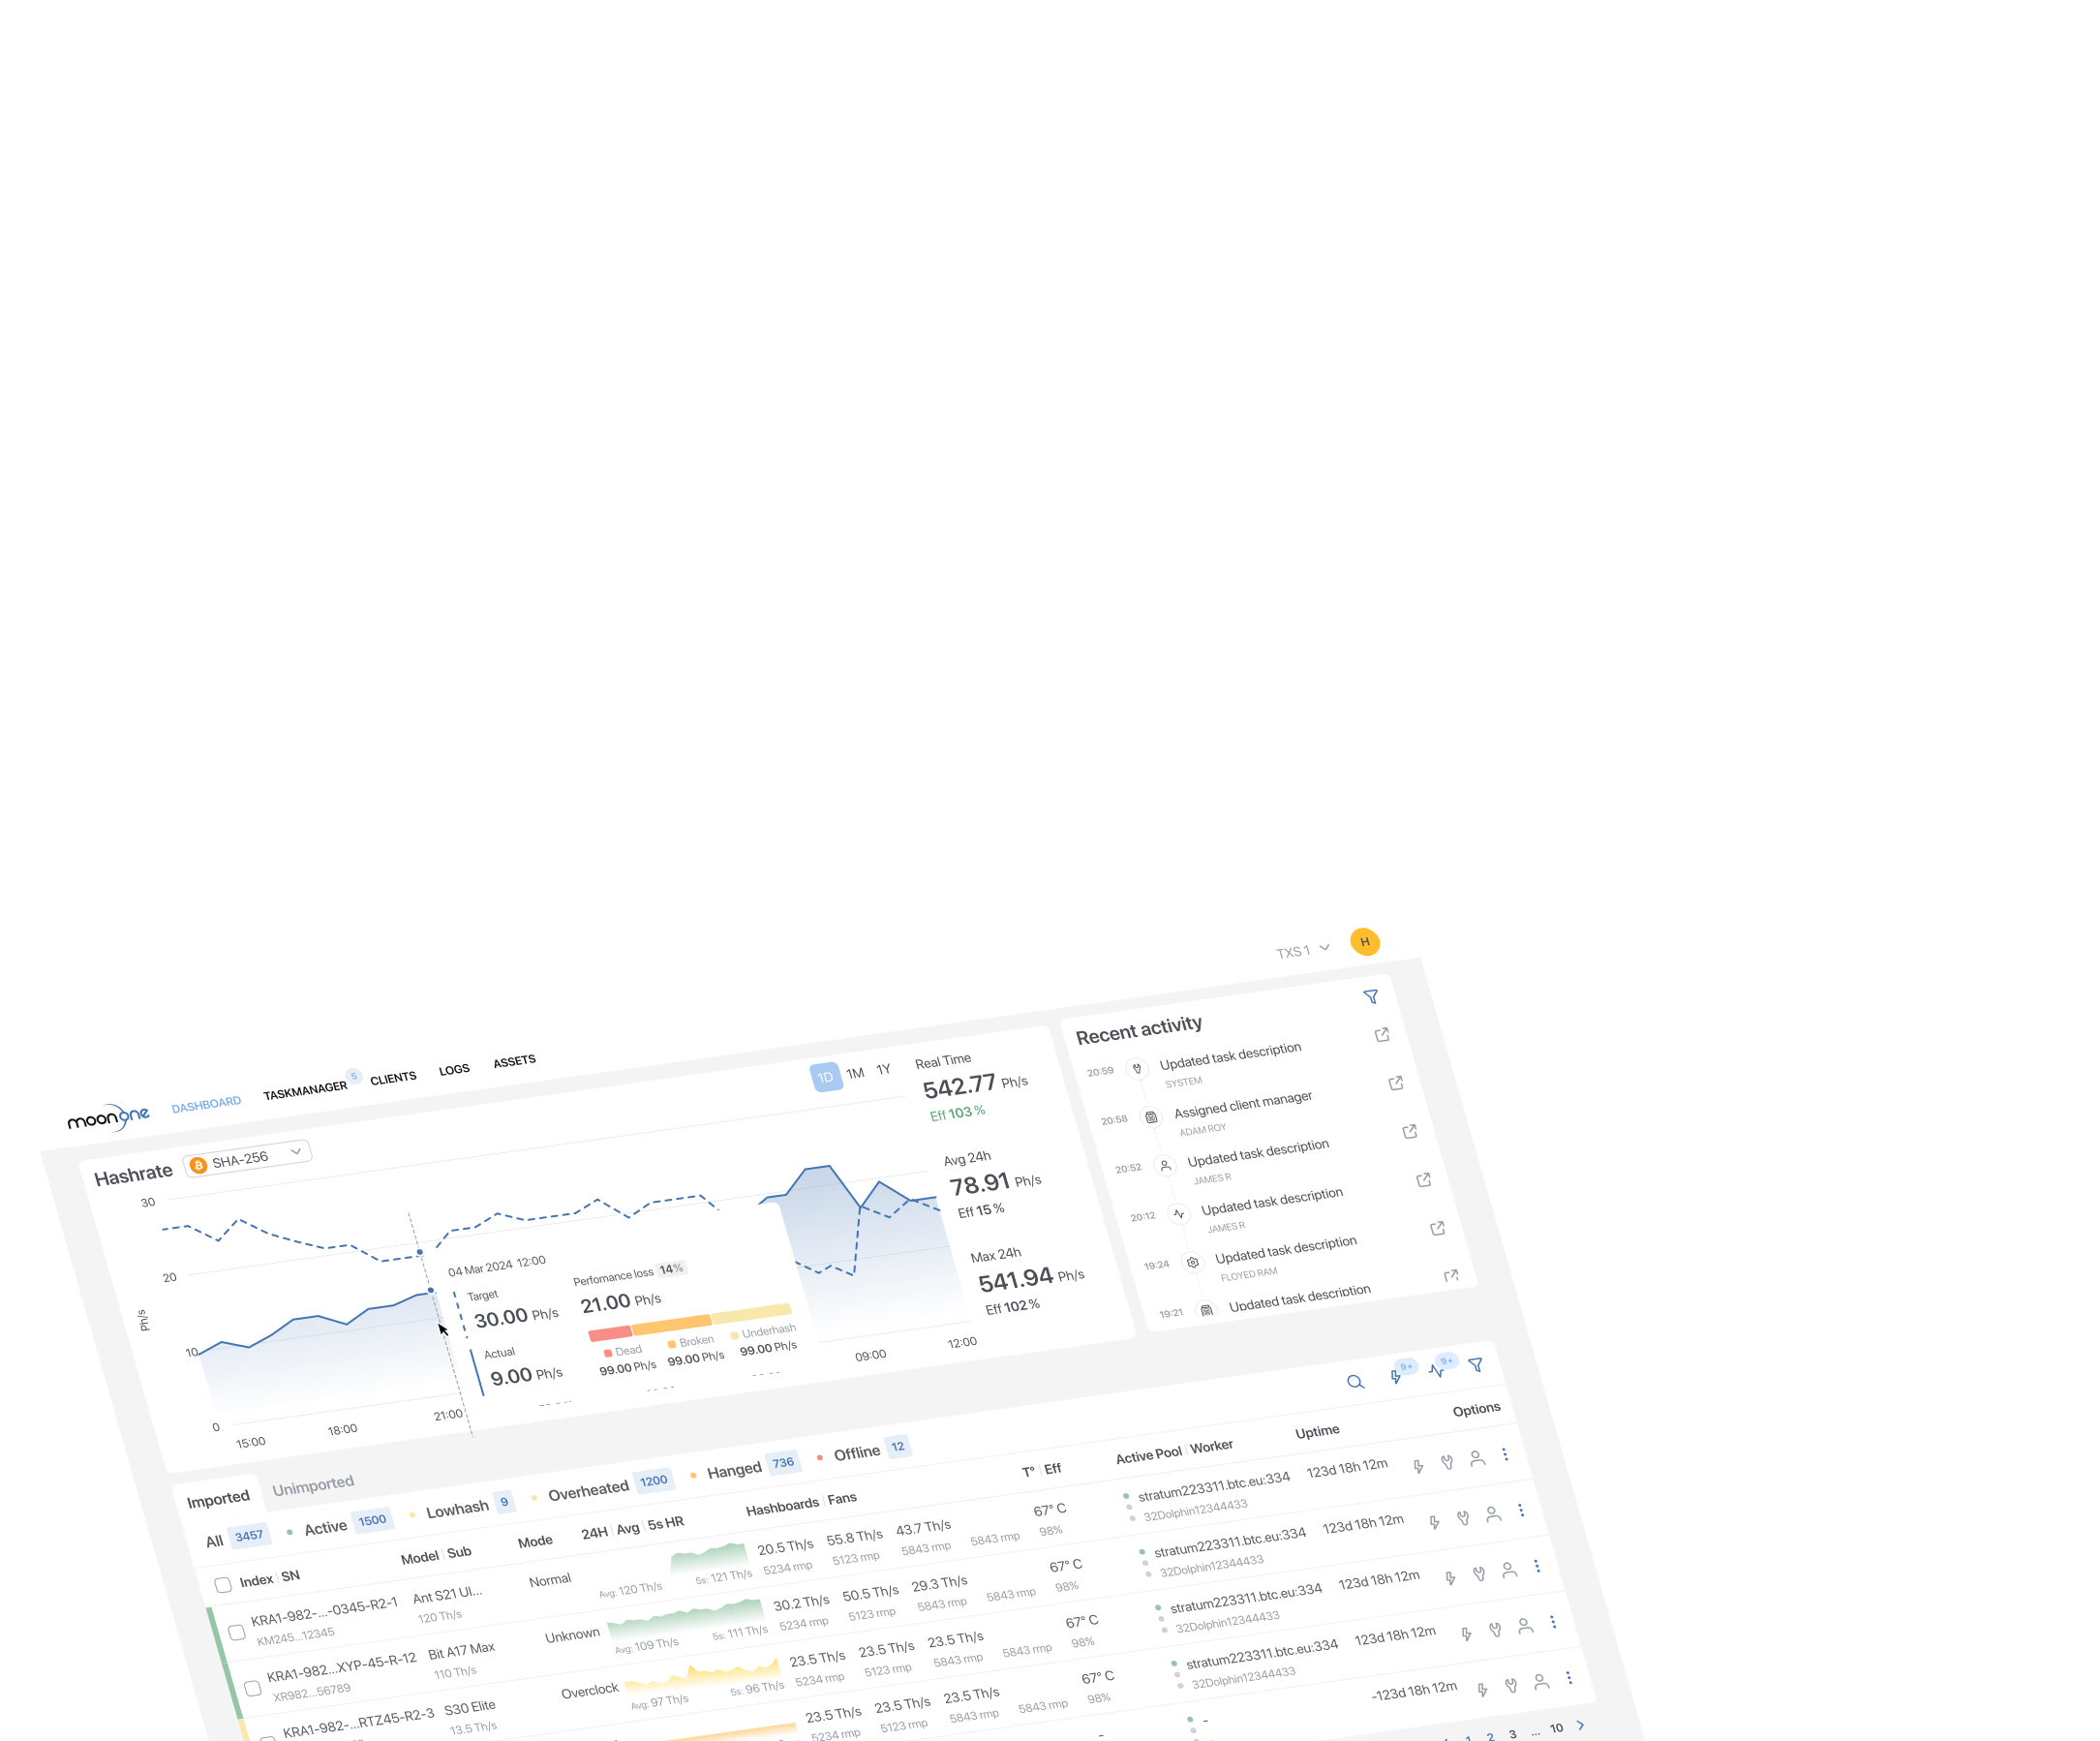
A well-designed visual site map changes the way teams work. Instead of switching between multiple dashboards and trying to correlate data, operators see the entire facility layout with clear, real-time visual indicators for every ASIC. This approach dramatically reduces the time needed to understand the current state of the farm and make informed decisions.
Two Powerful Analysis Modes That Change the Game
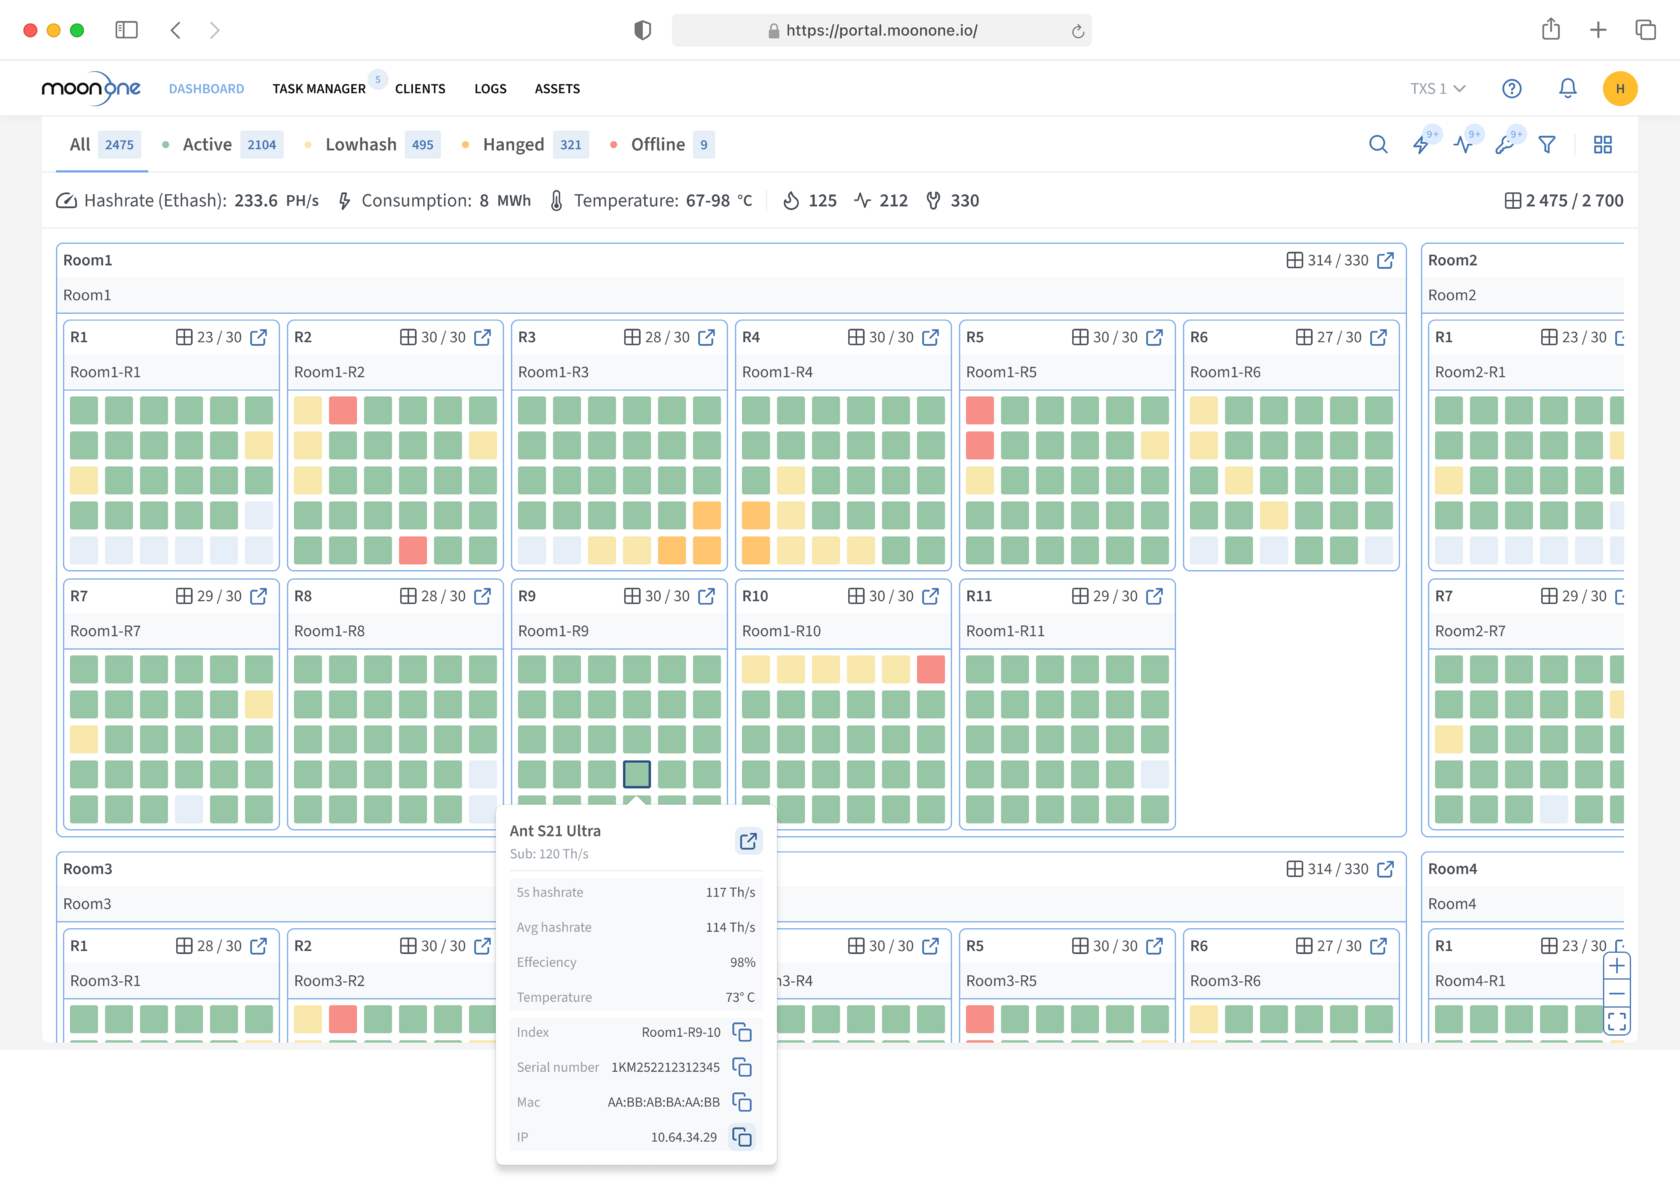
Moonone’s interactive site map offers two complementary analysis modes that operators can switch between instantly:
Hashrate Mode provides a clear view of production performance across the farm. It immediately highlights devices with reduced hashrate, hung miners, or completely offline units directly on the facility layout. This allows operators to quickly prioritize maintenance based on real financial impact — first addressing the miners that are losing the most hashrate, while less critical issues can be handled later.
Heat Map Mode visualizes temperature distribution in real time. Color-coded indicators show hot spots and potential cooling problems before they cause hardware damage. This mode helps technicians identify risky areas quickly and prevents expensive overheating issues.
The ability to switch between these two modes gives mining teams a powerful decision-making advantage. They can assess problems both from the perspective of immediate production loss (hashrate) and long-term equipment safety (temperature). This dual view is particularly valuable during heat waves, power fluctuations, or when scaling operations.
Want to see how the interactive site map works in practice? Try Moonone Free and explore the Visual Mining Site Map with Hashrate and Heat Map modes.
Want to see how the interactive site map works in practice? Try Moonone Free and explore the Visual Mining Site Map with Hashrate and Heat Map modes.
Real-World Advantages for Large Mining Farms
With the interactive Visual Mining Site Map, teams no longer need to walk around the farm or switch between different monitoring tools to understand what is happening. Everything important becomes visible on one screen.
Operators can:
- Instantly locate offline and problematic miners across the entire facility
- Identify overheating zones before they lead to hardware failure
- Prioritize maintenance tasks based on actual hashrate impact rather than guesswork
- Significantly reduce the time technicians spend searching for issues
- Maintain full visibility even when managing multiple sites or buildings
Many large mining operations report that implementing a visual site map noticeably improves response time and helps make better, data-driven maintenance decisions.
From Data Overload to Clear Prioritization
One of the biggest benefits of the Visual Mining Site Map is how it transforms overwhelming amounts of data into clear, actionable priorities. Instead of being flooded with alerts and raw numbers, operators can see at a glance which areas of the farm need immediate attention and which can wait.
This visual approach is especially powerful for farms with complex layouts or multiple locations. It helps bridge the gap between technical data and practical decision-making, allowing both managers and technicians to work more efficiently.
Combined with intelligent issue tracking and task management, the site map helps you not only find problems faster, but also resolve them more efficiently.
Combined with intelligent issue tracking and task management, the site map helps you not only find problems faster, but also resolve them more efficiently.
Conclusion
In 2026, effective Bitcoin mining management is almost impossible without strong visual tools. The combination of an interactive site map and heat map gives operators the ability to understand the real condition of their entire farm in seconds and act accordingly.
Moonone’s Visual Mining Site Map with Hashrate and Heat Map modes helps large Bitcoin mining operations move from reactive problem solving to proactive, efficient management — reducing downtime, protecting hardware, and maximizing the performance of every ASIC.
If you’re still managing your farm without a clear visual overview, this feature alone can significantly improve your operational efficiency and profitability.
Ready to get full visual control over your Bitcoin mining farm? Stop guessing where problems are hiding. Start Free Trial or Contact Sales to Book a Demo